The Dashboard is the area of Sonas which can be populated with the key reports that you wish to view each time you login. The company admin can create a standard dashboard for the whole company or each individual user can choose to personalise theirs with the charts that they wish to see. Invariably the Admin will have a more detailed dashboard, populated with financial and sales reports while other user roles may only have access to certain marketing charts. As with everything in Sonas it is down to your company how you wish to set this up for the team to ensure it works best for you. Every time you login to Sonas the dashboard will be updated with the latest information. The page will also auto refresh every 20 minutes to ensure your charts are always up to date.
Setting up or editing your dashboard
Step-by-step guide:
Click on the Dashboard section in the main menu.
If this is the first time setting up your dashboard you will see a blank page with the option to Add New Chart in a box on the left hand side and 3 green headings on the top right - Use Company Default, Set as Company Default and Finish Edit. In the initial setup, the company admin user can create a dashboard for all staff and set it as the company default here. As each subsequent new user joins Sonas, they can then select the company default to create a ready populated dashboard.

Assuming that you have a number of reports created already, you can then start to add in the charts that you wish to include.
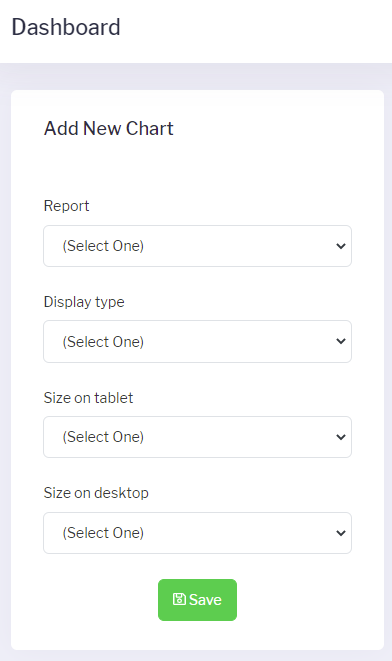
In the Add New Chart box select:
Report - choose from the drop down box of reports that you have created in your Sonas.
Display Type - select graph type that you wish to display from: Line, Bar, Horizontal Bar, Radar, Pie Chart, Donut, Area, Total Values, Total Values with Line.
Size on Tablet - select size of the chart that will be displayed when the dashboard is viewed on a tablet (Half Row or Full Row).
Size on Desktop - select size of the chart that will be displayed when the dashboard is viewed on a desktop/laptop (Quarter Row, Half Row or Full Row).
Click save at the bottom of the box to add the chart to your dashboard.
Repeat the process adding in as many graphs as you wish to have displayed on your dashboard.
To edit your dashboard and amend the setup or type of graphs on display click on Edit in the top right hand corner of the Dashboard screen. Each report can then be individually amended as required (e.g. graph type, size etc.)
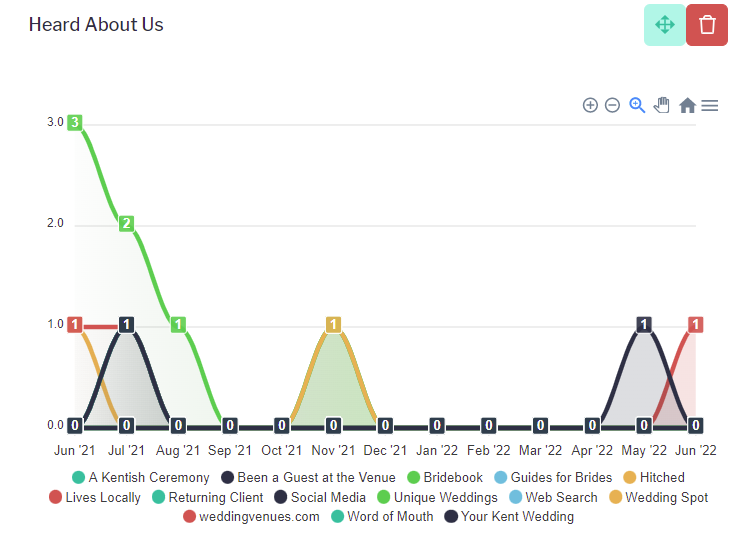
You can move the graphs around the dashboard whilst in editing mode by clicking on the multi arrow icon in the top right of the chart and dragging to a new position on the page.
You can also remove any unwanted graphs by clicking on the red bin in the top right of the chart.
Once you have the dashboard set up as you like it, click Finish Edit in the top right hand corner of the page to save the changes.