

There are a number of reports that can be generated within Sonas to allow you to analyse the information inputted into the system. You can find a basic list of the type of report that can be created in Sonas here, including sales, marketing and financial reports. Each one of these charts can be tailored to allow you to analyse stats for different venues and/or time frames so there are countless reports that can be created. Additional financial information can also be exported from the Accounts and Transactions section which you will find in the Company sub menu. This is outlined in more detail at the bottom of this page.
Once you have created a selection of reports you can personalise your Dashboard with the statistics you wish to see at a glance on a daily basis.
Reports: Step-by-step guide:
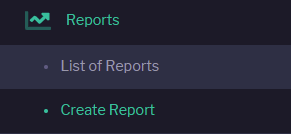
Click on the Reports section in the main menu.
Click the Actions menu in the top right hand corner and then + Create New Report (There is a shortcut to create report in the left hand sub menu too)
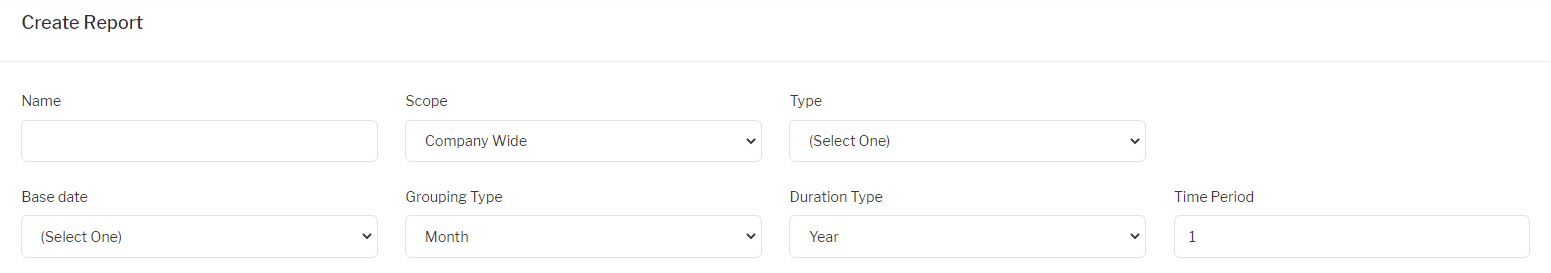
Your report will be broken into two sections. The first section is the top two lines of information which will create the overall base of the report i.e. what it will be called, what type of report it is (sales, marketing, financial for example) and the time frame you want it to show you. Essentially this is creating the horizontal and vertical axes of the graph.
 Complete the following categories:
Name (what you will call this report)
Scope (whether it is company wide or venue specific if you have more than one venue setup in Sonas)
Type (the type of report you wish to generate - see the full list of available report types and respective subcategories here)
Base Date (choose either Created Date or Event Date for marketing reports, Event Date for sales funnel reports and/or Due Date for some of the financial reports.)
Grouping Type (choose by Day, Week, Month, Year or Total - this can give you a very detailed report such as daily figures or a more generic one over a longer time period)
Duration type ( choose from Day, Week, Month,Year - this is the timeframe in which you want to reflect in the report)
Time period (number of Duration Type selected above e.g. 1 year or 6 months)
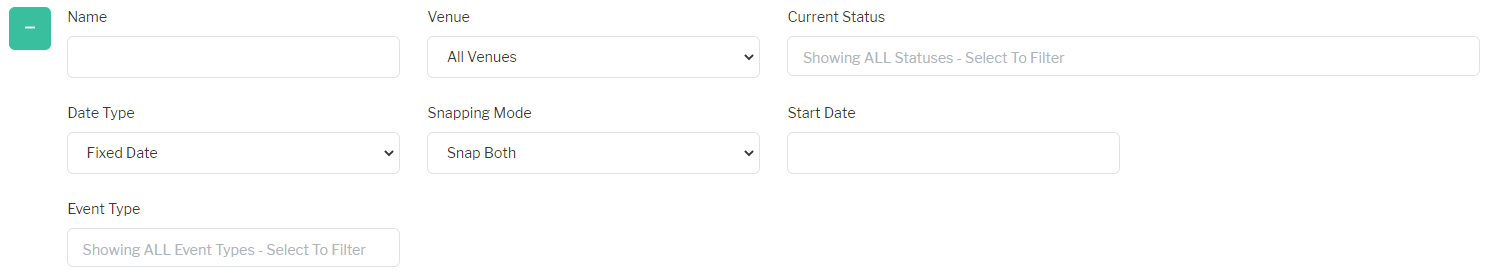
The second section of the report can be found in the subsequent boxes below. Each of the different boxes when completed will formulate the different lines of information on your newly created graph.
 Complete the following categories:
Name (of the different line to be added to the graph)
Venue (that the data relates to)
Current Status (of the events you are reporting on - all statuses are selected as standard but can be individually added from the list of Cancelled, Completed, Confirmed, Confirmed-Pending, Date on Hold, Enquiry, Exhausted, and Idle)
Date Type (Choose from Fixed Date, Relative- Starts Today or Relative- Ends Today) For reports that you wish to be constantly up to date it is best to choose a relative date type ending today or starting from today. For a particular time frame choose a fixed date type. Note: you will need to manually amend fixed date reports in the future to ensure they are up to date..
Snapping Mode (means to round up the start or finish of the report (or both) of them to the nearest month)
Offset Unit (Choose from Day, Week, Month or Year if you wish to offset the report to start or end it by a fixed amount)
Offset Amount (as above)
You can add in additional lines to your graph with different parameters by clicking on the + at the bottom of the page.
Click save in the top right hand corner of the screen to save the changes for your report.
To run the report for the first time, click on General in the left hand sub menu above Settings.
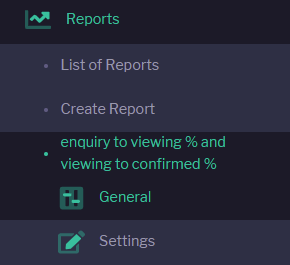
Click the Actions menu in the top right hand corner and then >Refresh Report Values. You will receive a warning message that generating the report will wipe existing results, click okay to continue and generate the graph.
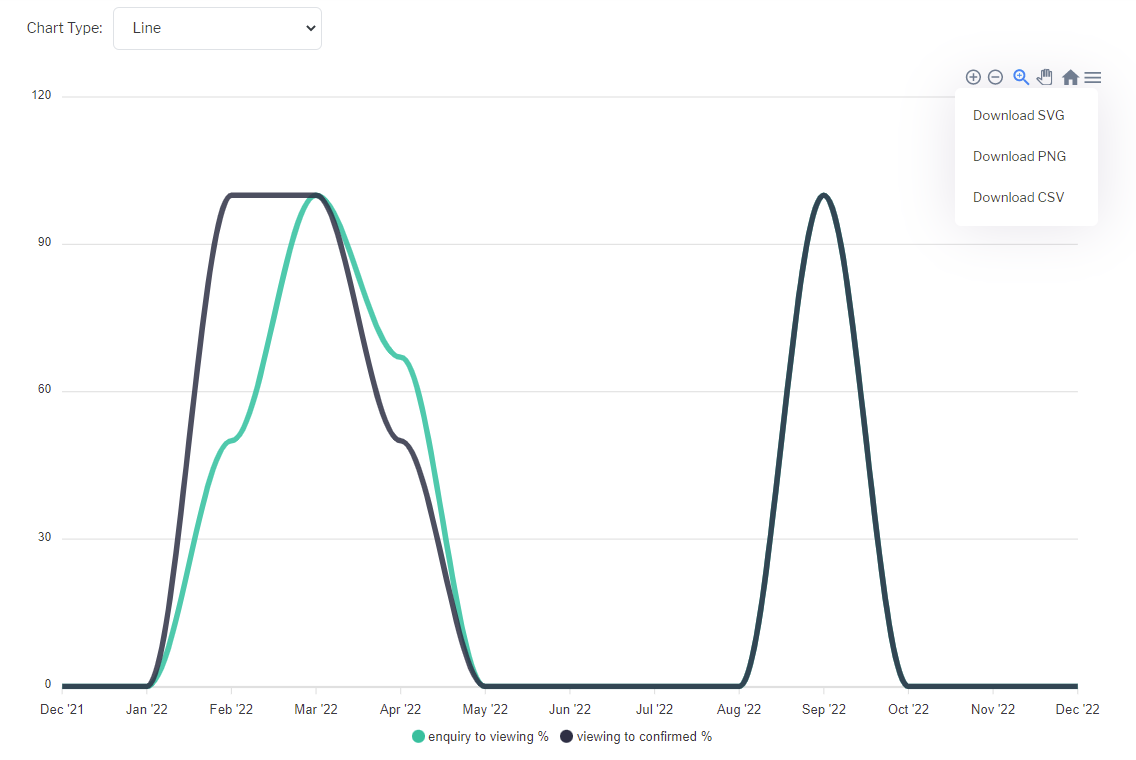
You can amend the chart type (line, bar, horizontal etc.) by clicking on the drop down box in the top left hand corner of the report screen.
You can also download the complete results of the report into a spreadsheet by clicking on the 3 horizontal lines (aka menu) in the top right hand corner of the chart.
Exporting financial account data by date - based on events:
Step-by-step guide:
Click on the Accounts section in the main menu.
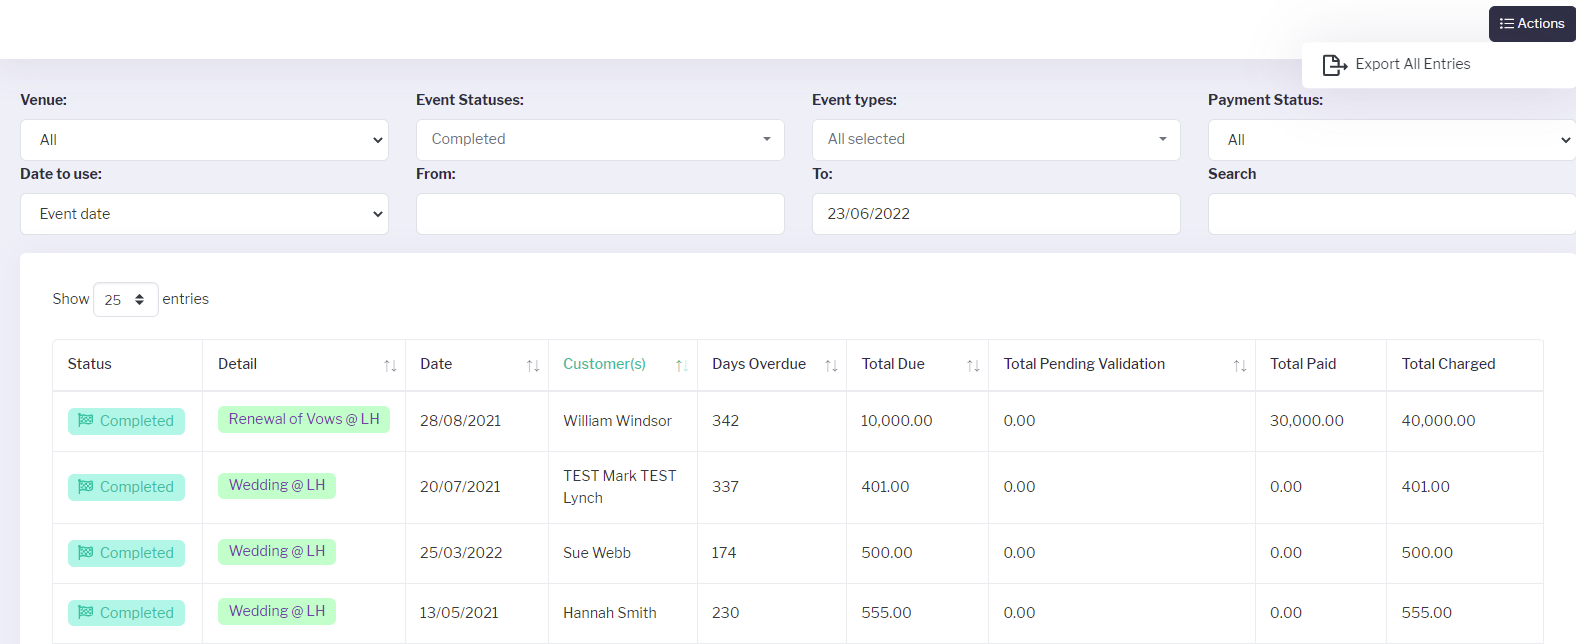
Change the parameters as required to create your desired report e.g. dates, event types and/or statuses.
Click the Actions menu in the top right hand corner and then >Export all Entries.
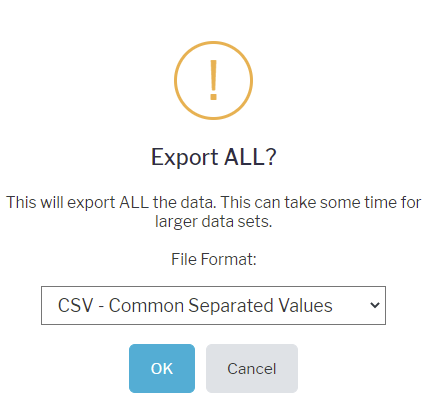
You will receive a warning message about the export of all entries (as listed on the screen after your filters have been applied) with a drop down menu of how you wish to export them. Choose from CSV, XLSX or ODS depending on which programme you wish to open the results in and press OK. For Google Sheets or Excel, exporting by CSV is the preferable option.
You can then use this data to create your own reports, tables and graphs as required.
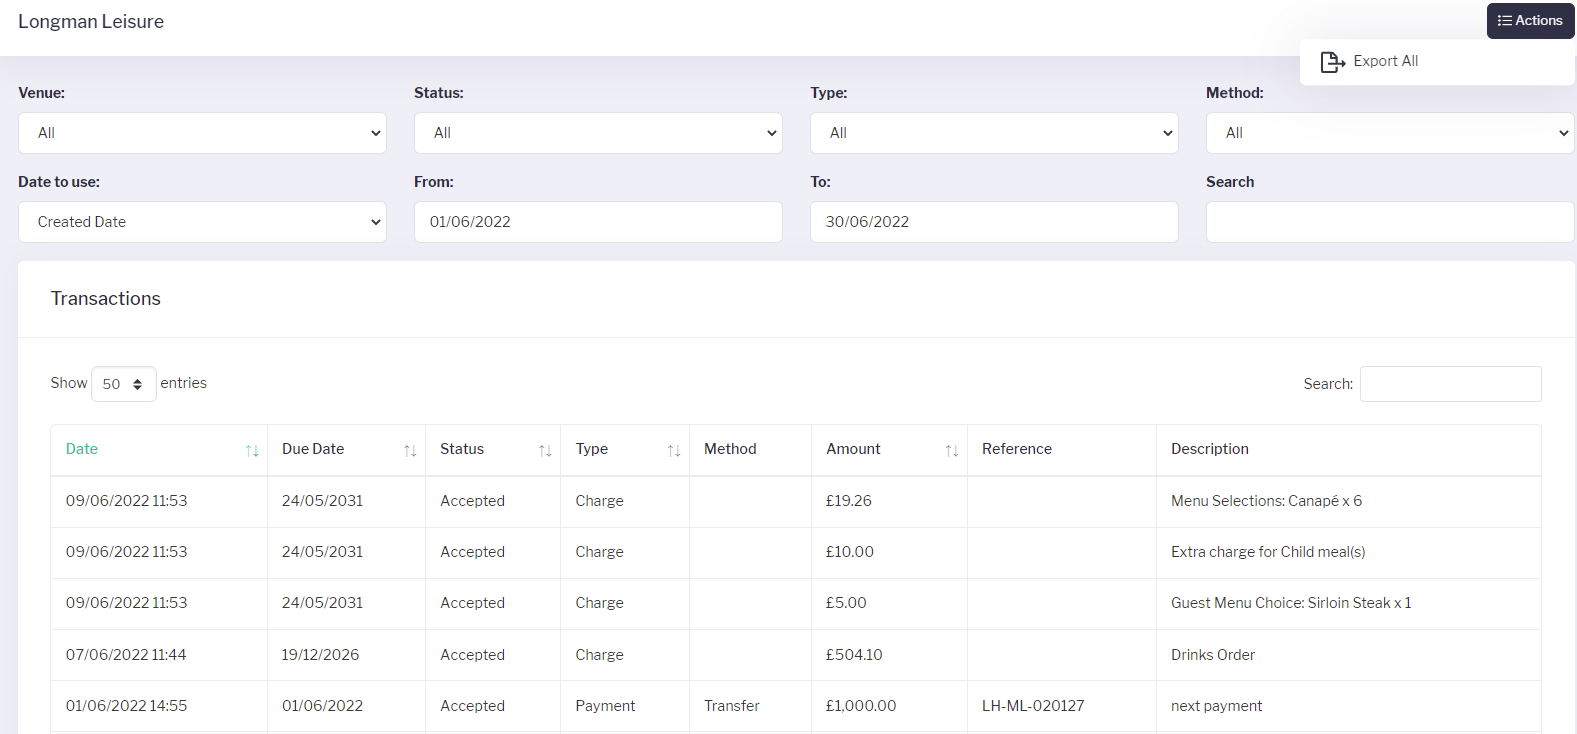
Exporting financial transaction data by date - based on payment types and method:
Step-by-step guide:
Click on the Company section in the main menu.
In the sub menu click on Transactions.
Change the parameters as required to create your desired report e.g. dates, status types and/or payment method.
Click the Actions menu in the top right hand corner and then >Export all.
You will receive a warning message about the export of all entries (as listed on the screen after your filters have been applied) with a drop down menu of how you wish to export them. Choose from CSV, XLSX or ODS depending on which programme you wish to open the results in and press OK. For Google Sheets or Excel, exporting by CSV is the preferable option.

You can then use this data to create your own reports, tables and graphs as required.