

Below is a list of the basic reports that can be created and individually tailored in Sonas. Each report has a number of different parameters that can be amended to highlight the key performance indicators that you wish to analyse. These parameters include filters for date, event status, event type, tags, venue, and transaction type, just to name but a few. By mixing different filter selections, a large amount of reports can be generated for your team to review. The important ones, or those that you want to review on a daily basis, can then be added to your Sonas Dashboard for convenience (see Dashboard). These are updated and refreshed every time you login.
The reports discussed in this article are specifically the visual reports, such as line graphs. Financial and accounting spreadsheet reports can be found here.
This article is a high level look at the different types of reports that can be created with examples and links to a more in depth look at each type.
If you cannot see this section or get permission denied messages with any of the actions, please contact your Company Admin in order to get the required permissions.
Where to find reports
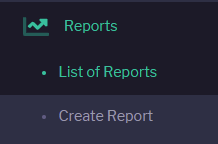
The Reports Section is located in the main toolbar on the left. Reports has a submenu that contains the List of Reports, which are you created reports. And Create Reports, which allows you to create a new report for the list.
How to create a new report
- Navigate to Create Report, you can choose the parameters to meet your needs.
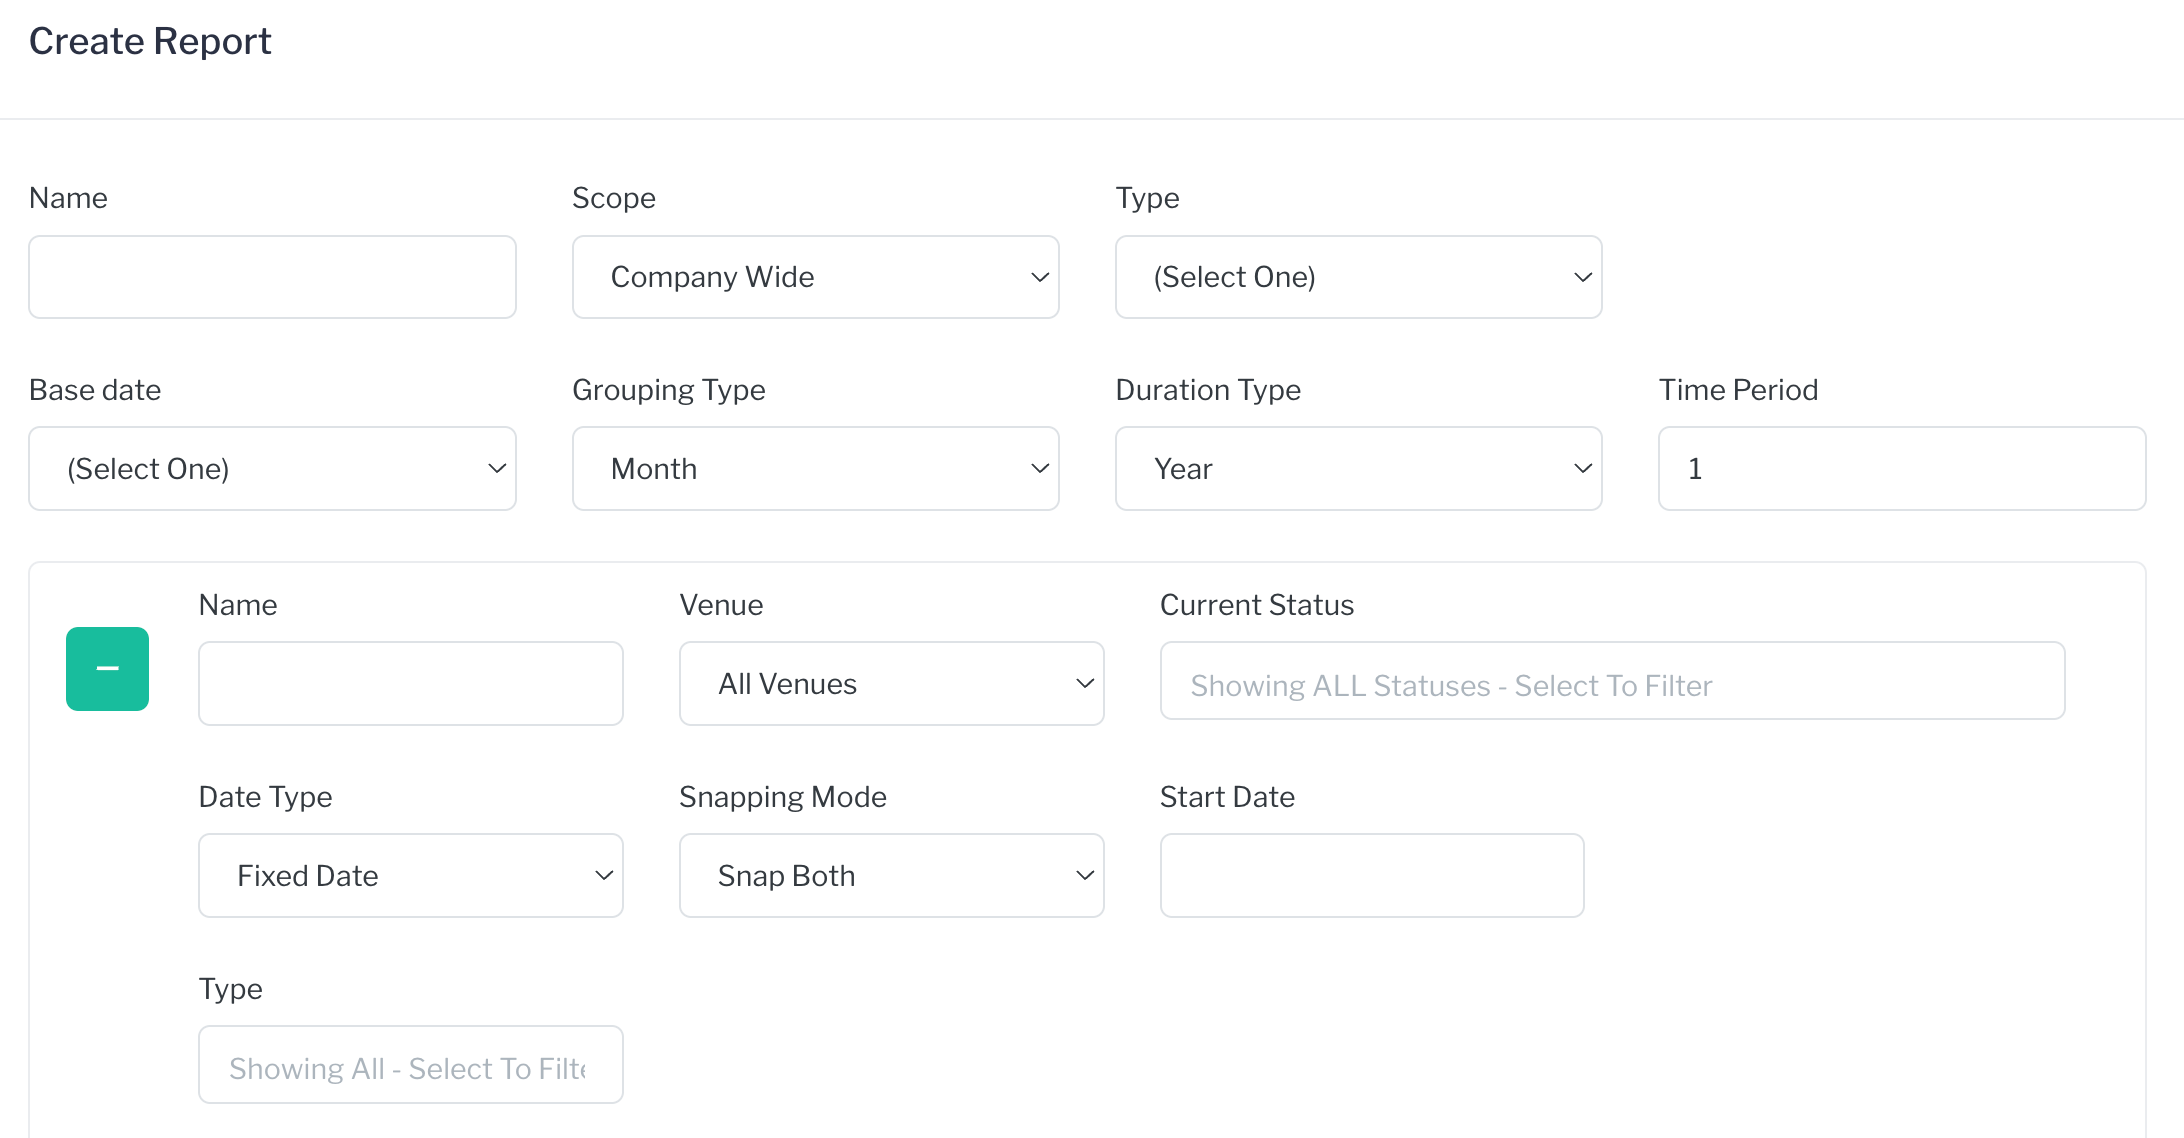
- Name your report in a way that will allow you to know what it contains with ease.
- Scope, Select the report to be run on the company as a whole, or for a specific Venue.
- The Type selection will determine the other parameters and filters available.
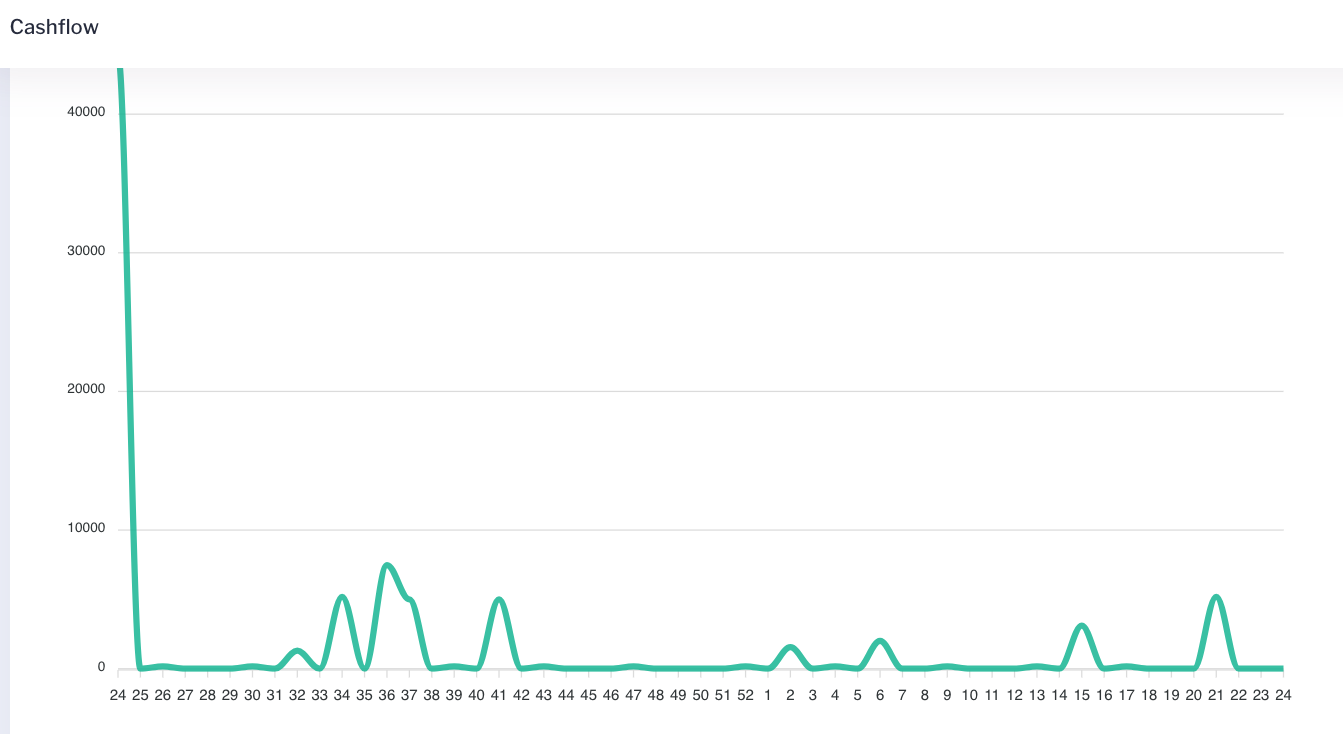
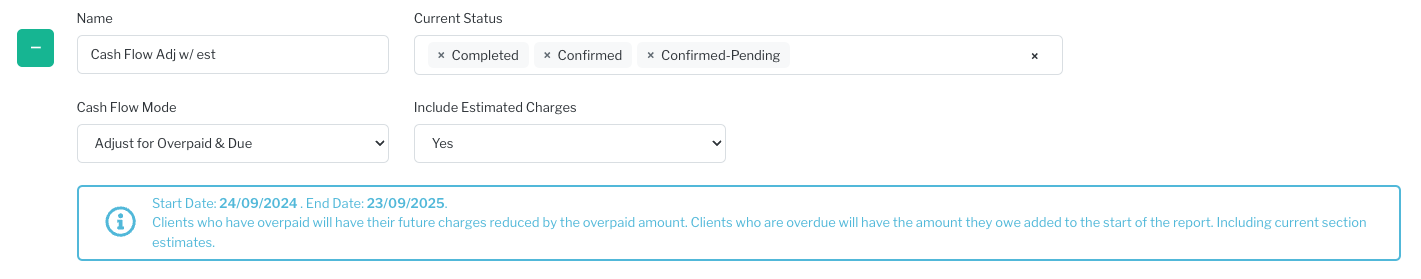
- Cash Flow - See accurate predictions of cash flow in the coming months. Can adjust for clients who have either overpaid or are overdue. Includes incoming escrow payments.
- Customer Location Track where your enquiries or confirmed events are coming from on a map.
- Custom Event Customised report based on number of event types or statuses.
- Custom Transaction Customised report based on payment transaction type, e.g. transactions by credit or debit card.
- Custom Activity Customised report of specific activities recorded within Sonas.
- Attended Meeting
- Attended Open Day
- Attended Show Around/Viewing
- Attended Tasting
- Event Cancelled
- Event Completed
- Event Date Held
- Event Exhausted (enquiry)
- Event Idled (enquiry)
- Event Pre Confirmed
- Initial Enquiry Made
- Meeting Booked
- Returned to Enquiry
- Show Around Booked
- Sales Funnel Track sales related metrics. The conversion rates work off the initial enquiry date - with the conversion happening anytime subsequently.
- Enquiry to Viewing %
- View to Confirmed %
- Enquiry to Confirmation %
- Enquiry Count
- Viewing Count (number of viewings with attended status)
- Confirmation Count
- Event MarketingTrack results of marketing effort with the following parameters:
- Heard about us
- Enquiry source
- Reason not booked
- Venues considered
- Venue booked
- Base date options is determined by the report type. It is the date is report is based on, such as a due date, event date, enquiry date or created date.
- Grouping Type, if you want the info grouped daily, weekly, monthly, yearly or total for select report types.
- Duration Type, how you want to define the duration of your report, by day, week, month or year.
- Time Period, how many of the chosen duration type you want run, e.g. 3 years.
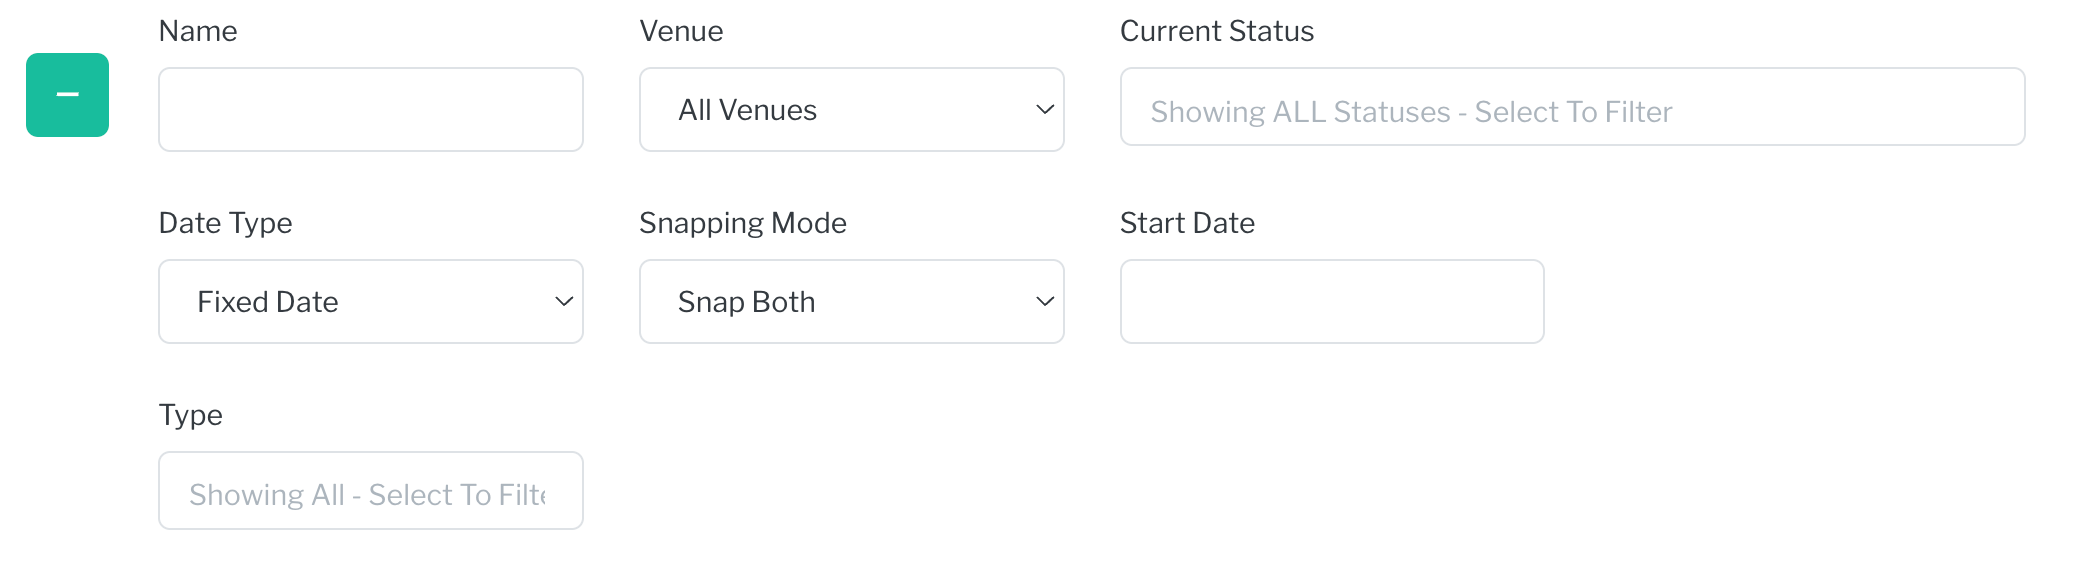
- Create each line for the report, there needs to be at least 1. The options are dependent on each type of report. Here you can compare different venues, different time periods, and more.
- Click Save, creating a submenu for your report on the left toolbar.
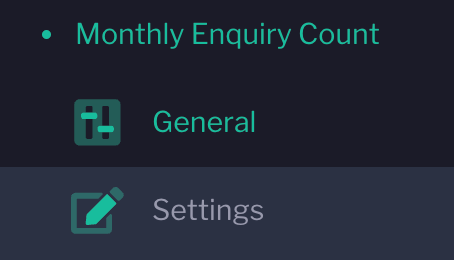
- Select General on your report's submenu.
- The report will open, but you need to run it. Click Action > Refresh Report Values
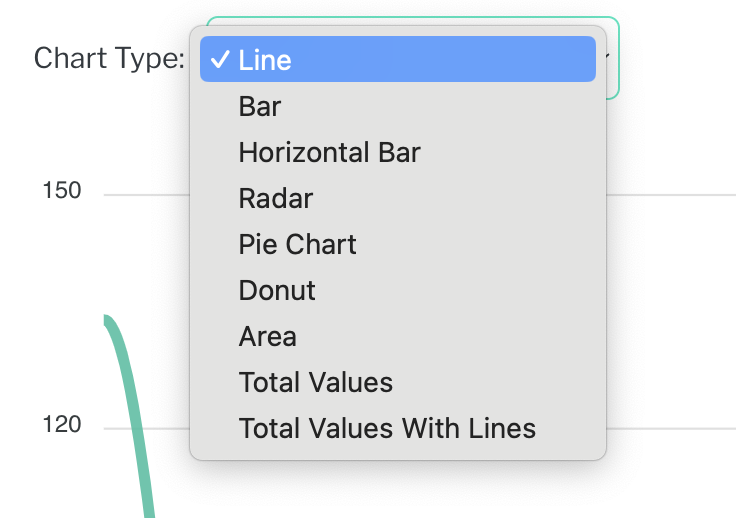
- Change the Chart Type to best meet your needs.
- Anytime you revisit the report, be sure to go Actions > Refresh to have the most up to date information.
How to clone a report
If you have a report that you want to copy and make minor changes to, you can. This may be to change the date range, the venue, etc.
- Navigate to the report you want to clone/duplicate. Reports > List of Reports
- Go to the report's Settings.
- Go to Actions > Clone
- Confirm on the pop up.
- The settings of the new report appear, be sure your rename and adjust the settings as you want. You will not be able to change the Scope or the Report Type.
- Click Save.
- Go to the Report's General Section.
- Run the report, Actions > Refresh Report Values
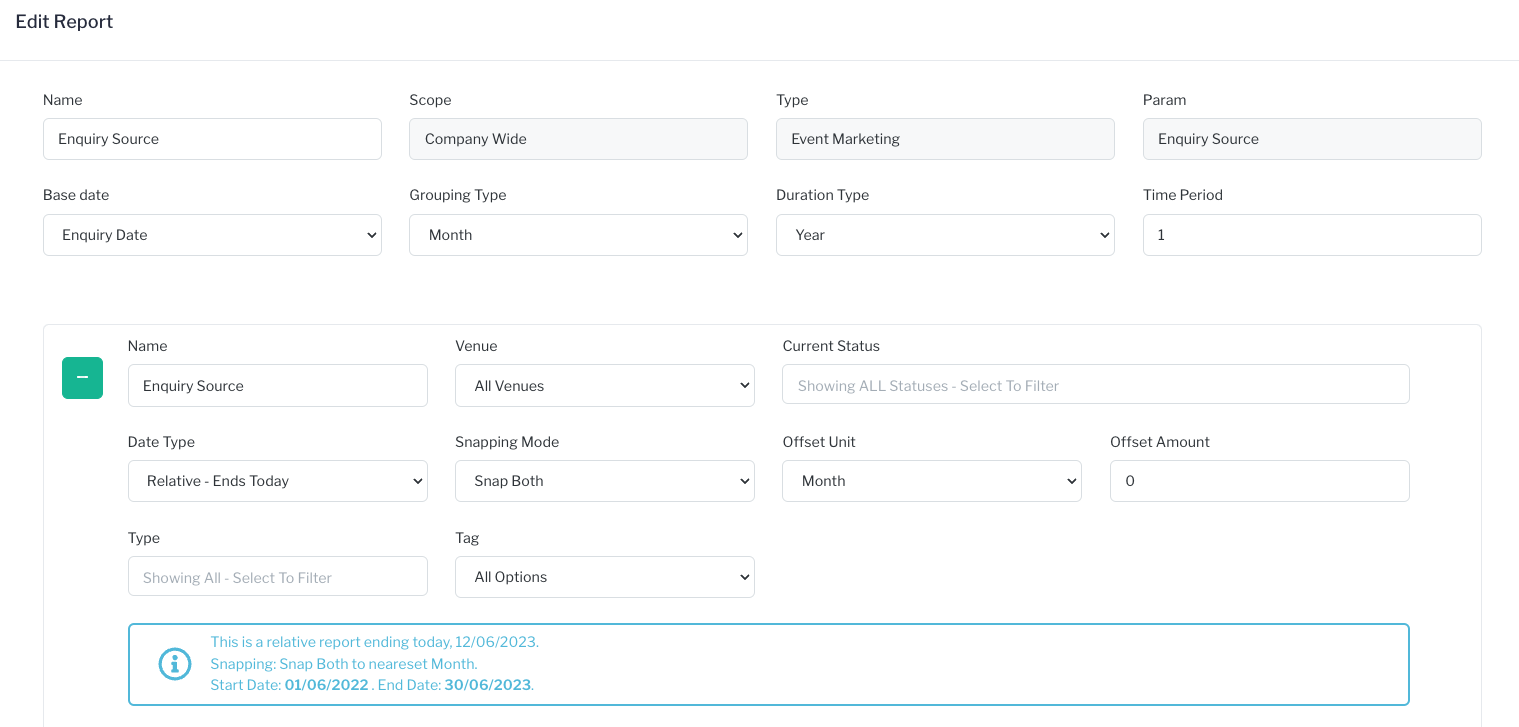
How to edit a report
Report Examples (screenshot of the report and the report settings):
Cash Flow
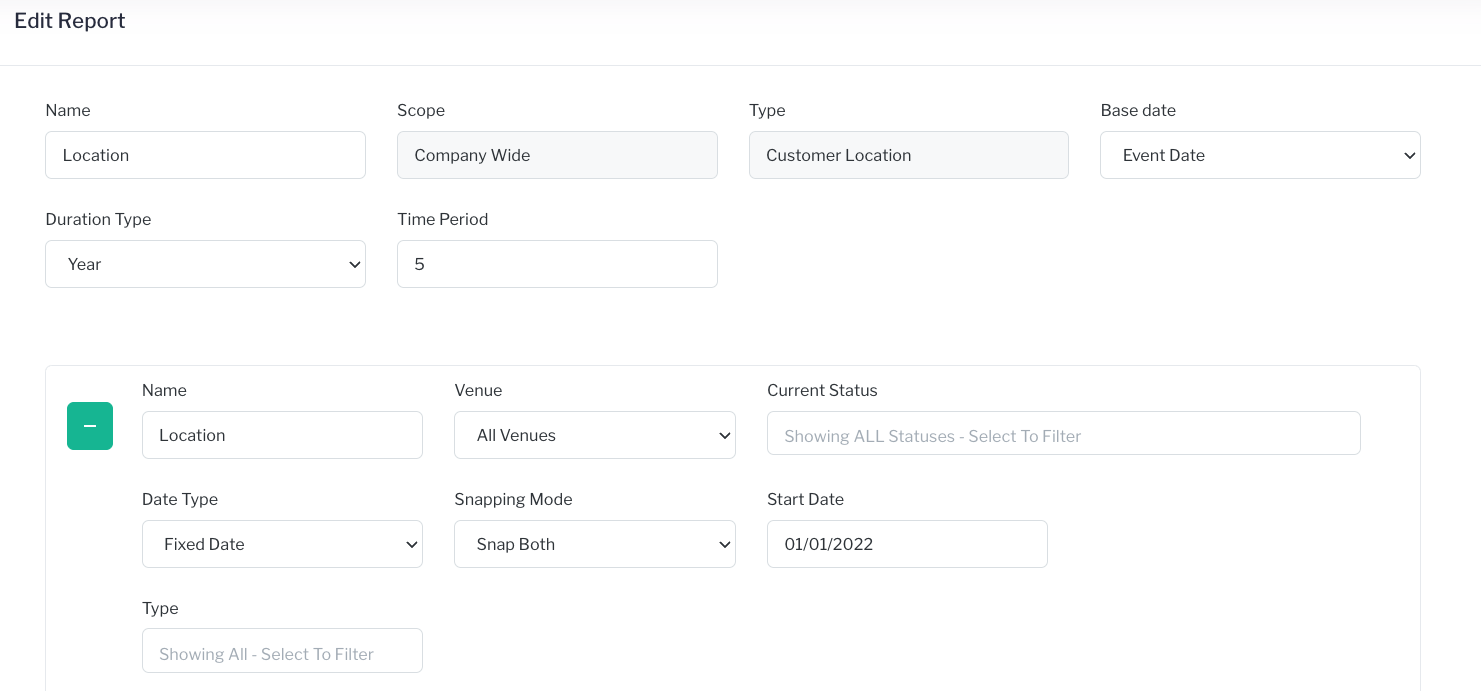
Customer Location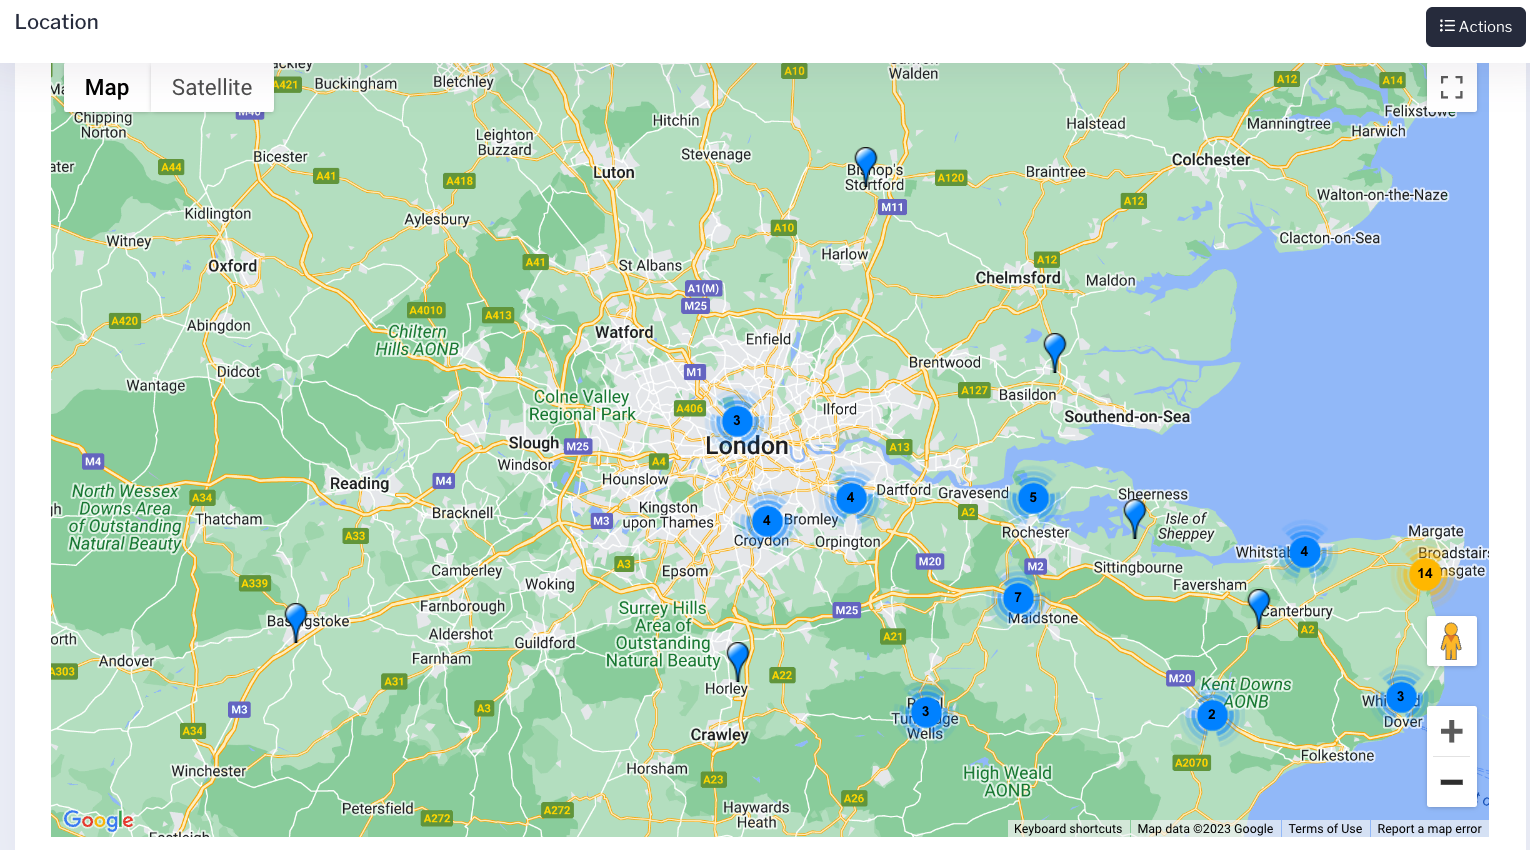
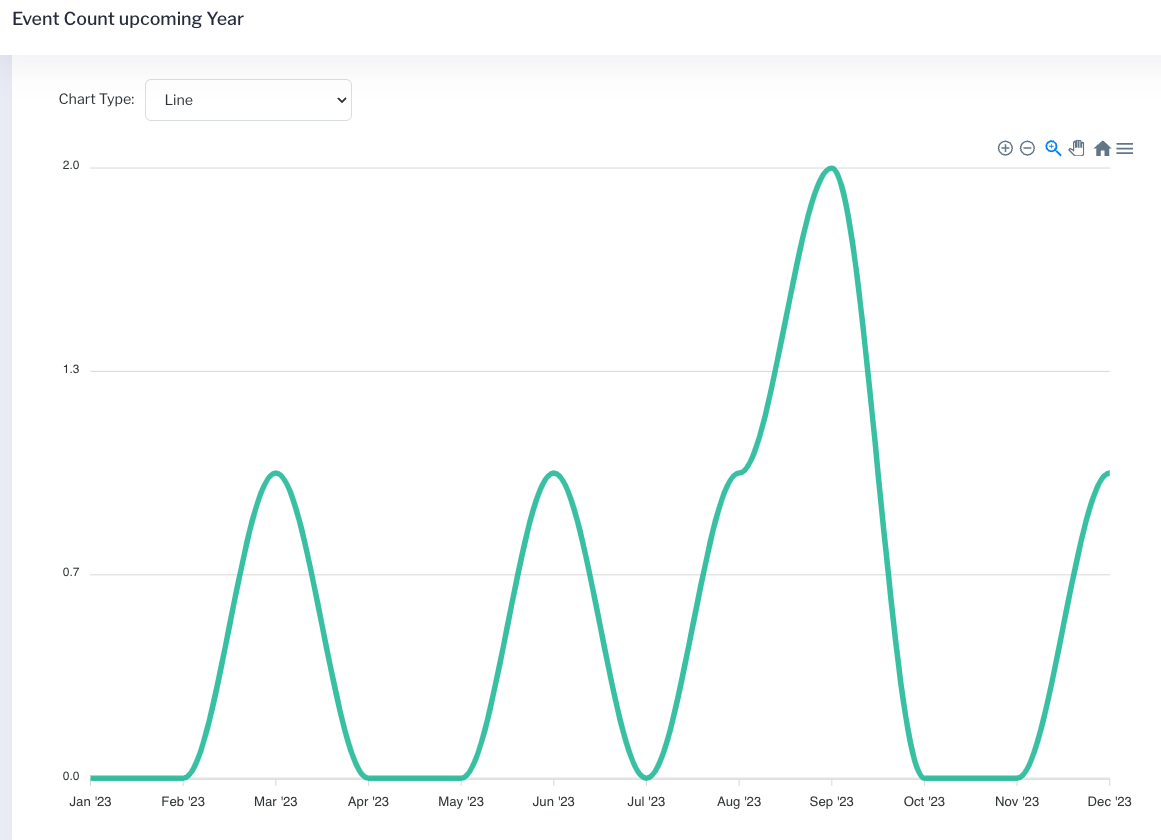
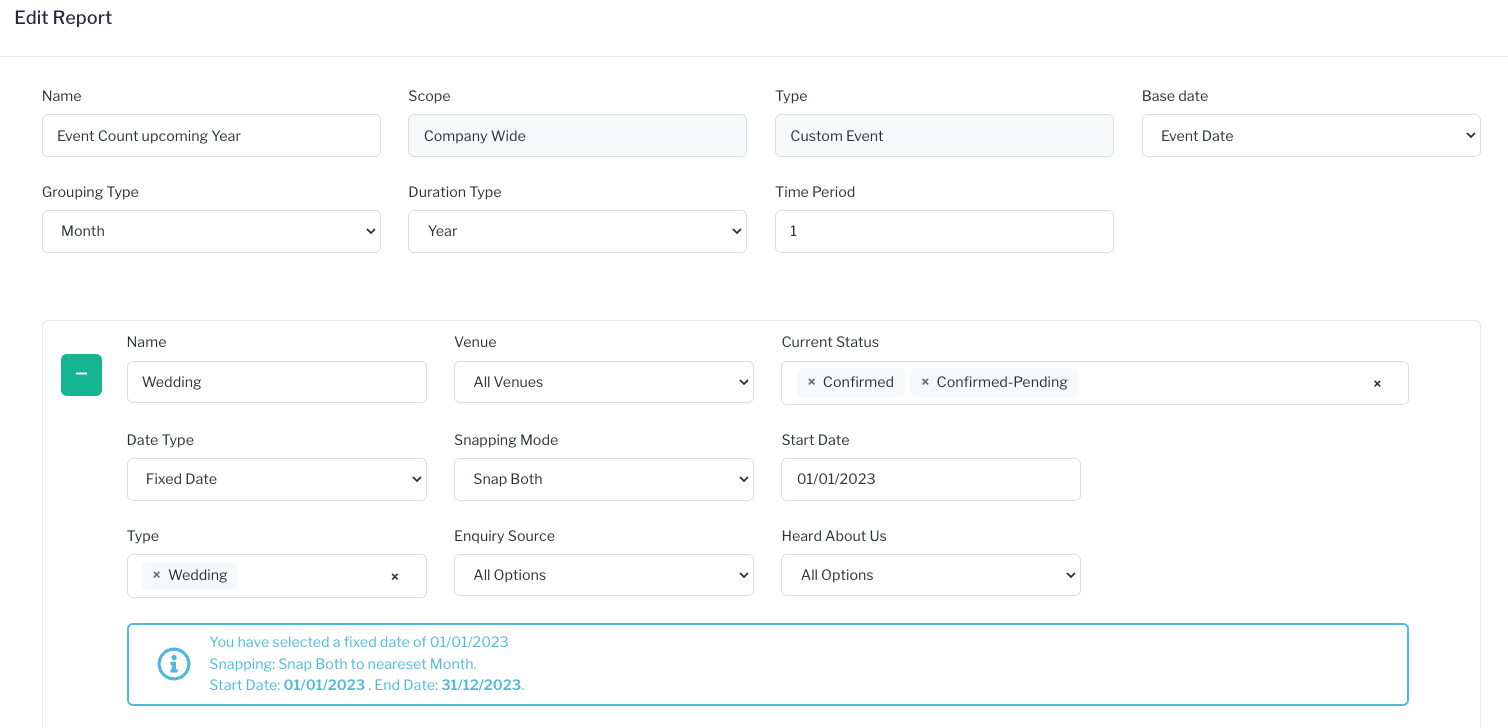
Custom Event
This specific custom event report is the event count by type, per month, over a year.
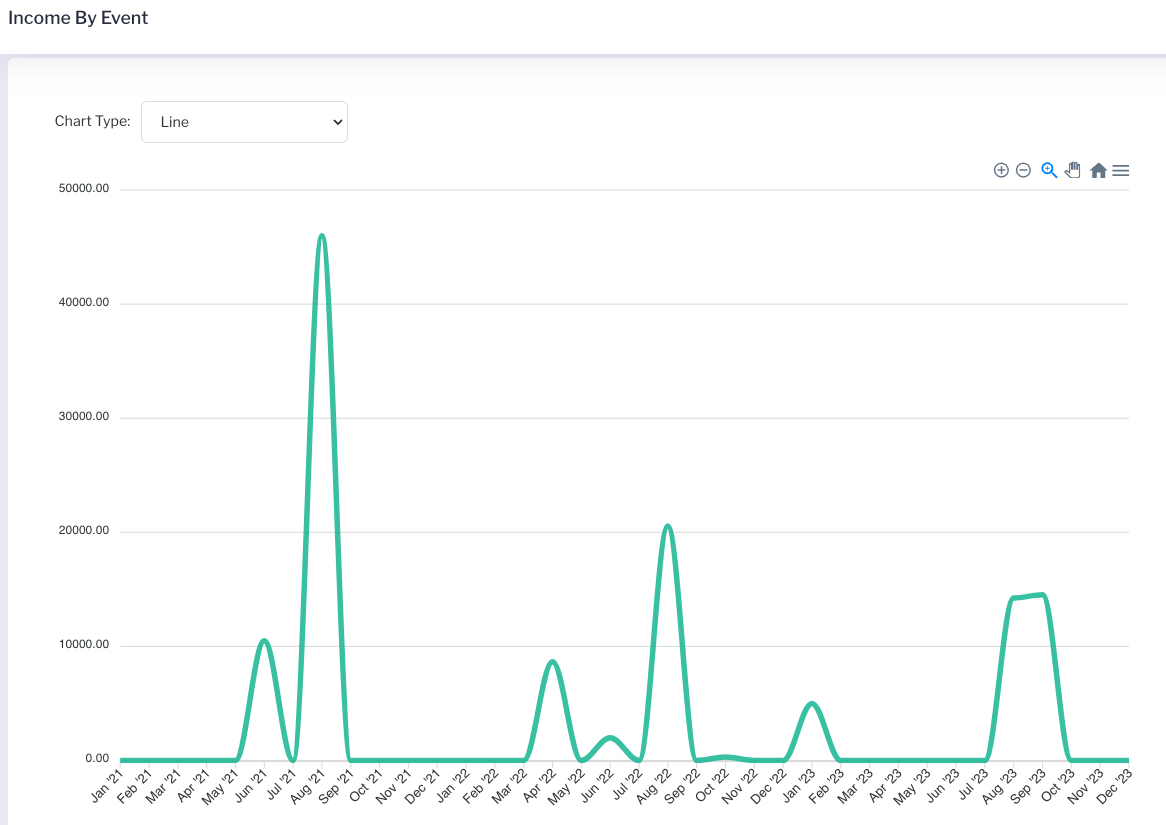
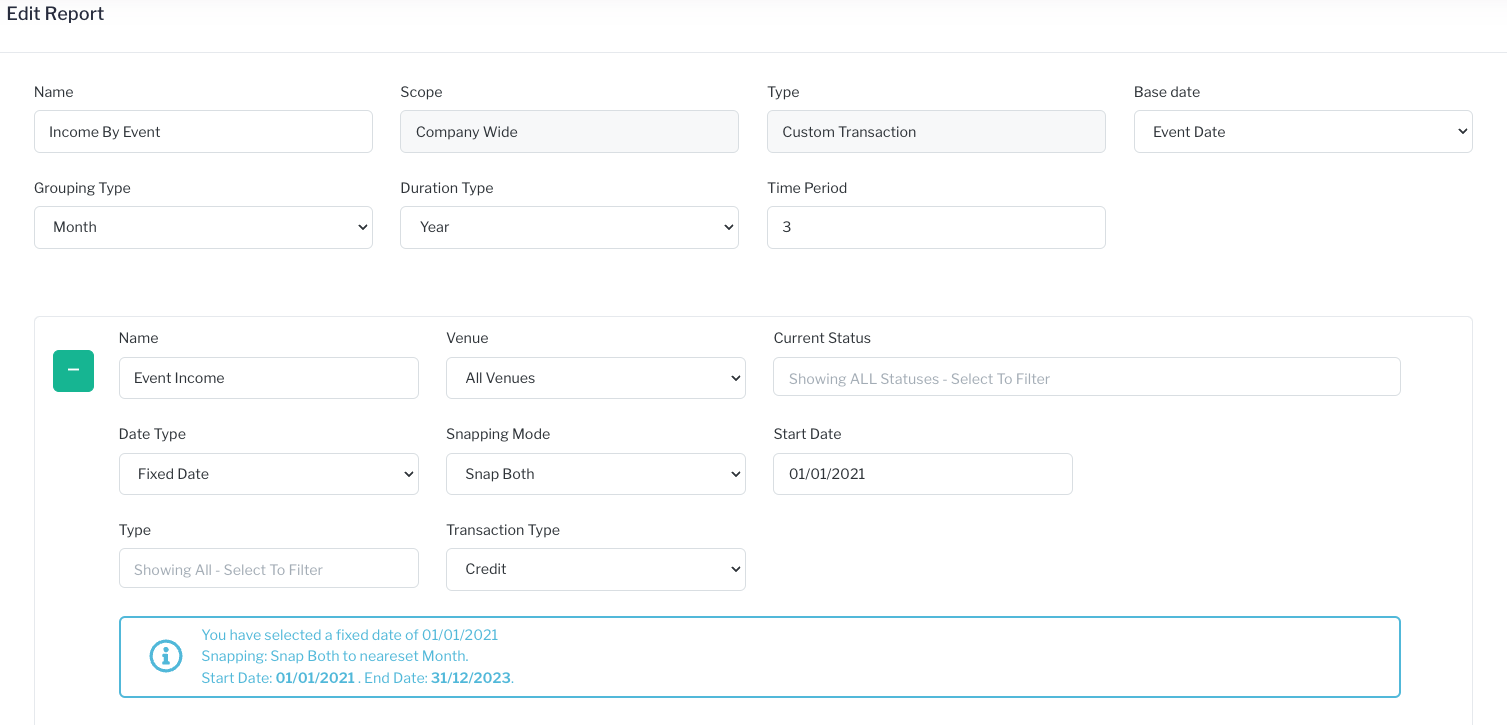
Custom Transaction
This example of a Custom Transaction report looks at event related income per month, based on the event date, over 3 years. The transaction type is Credit.
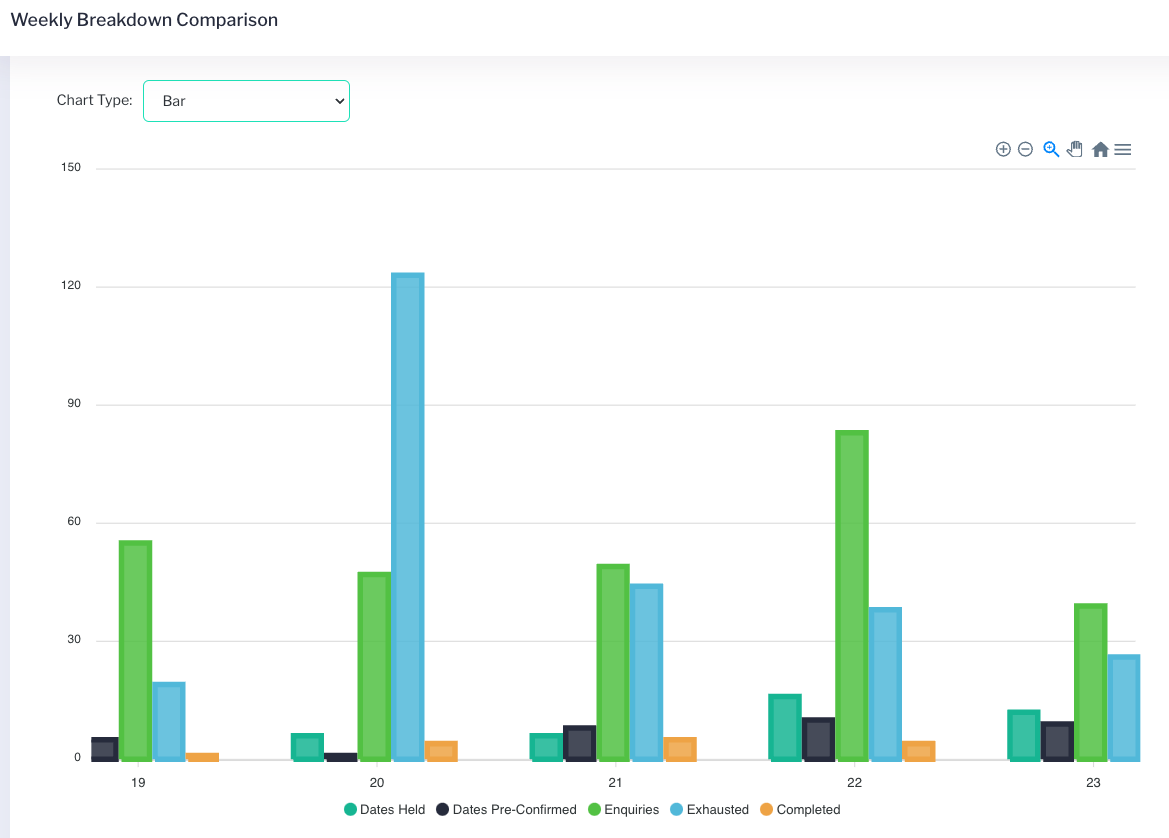
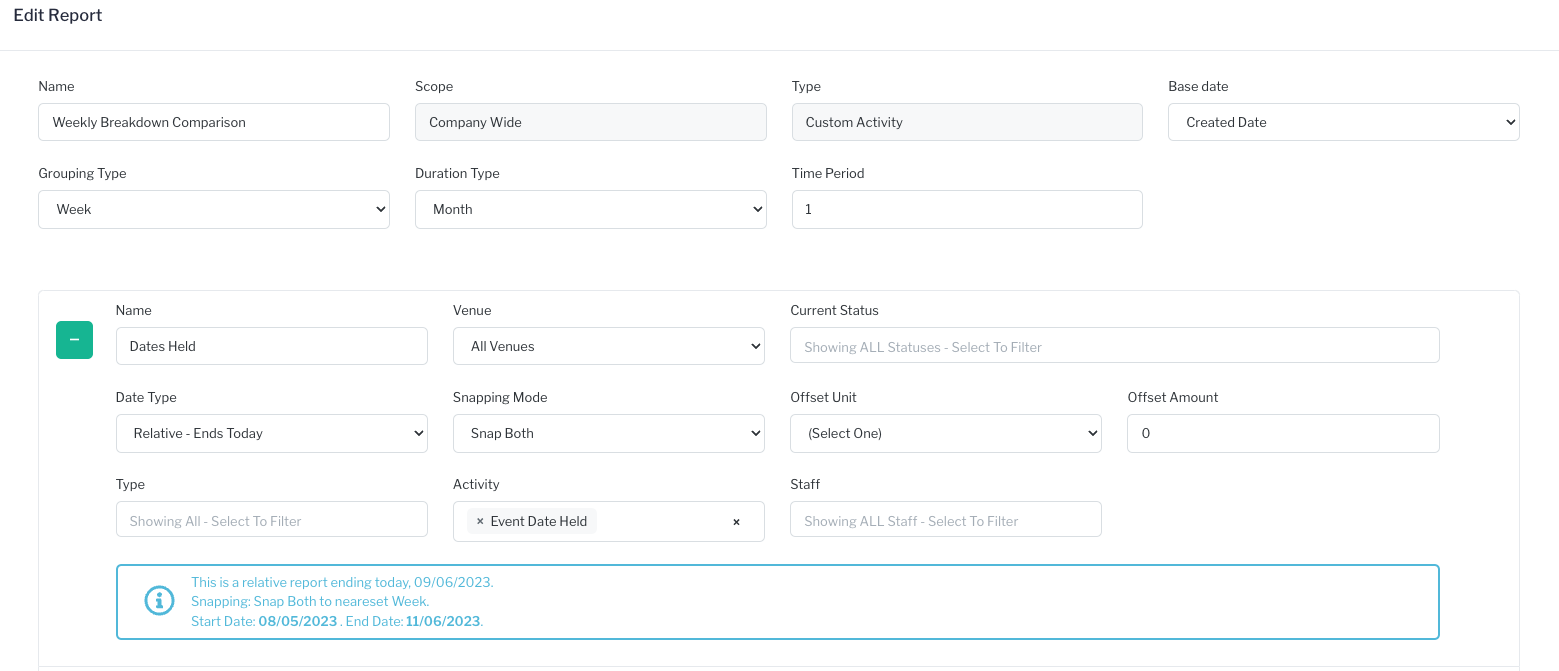
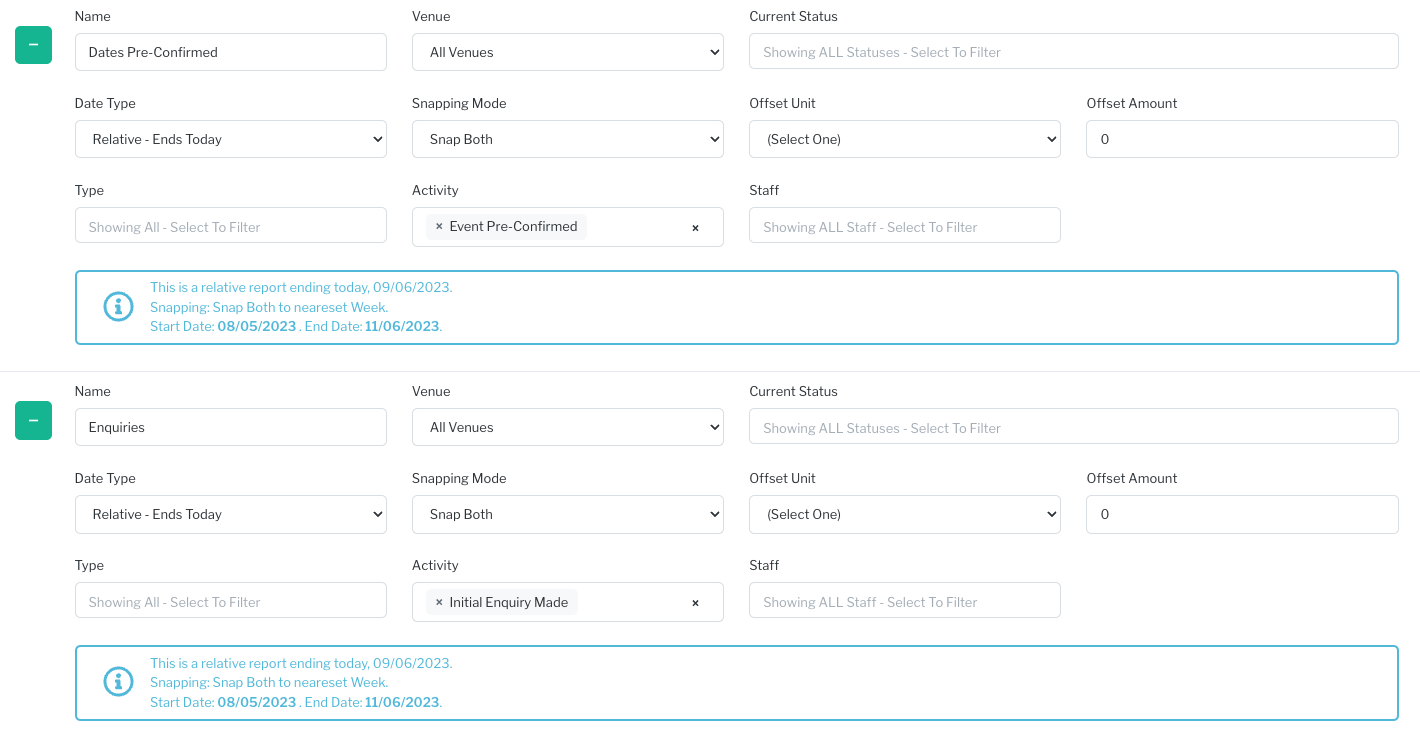
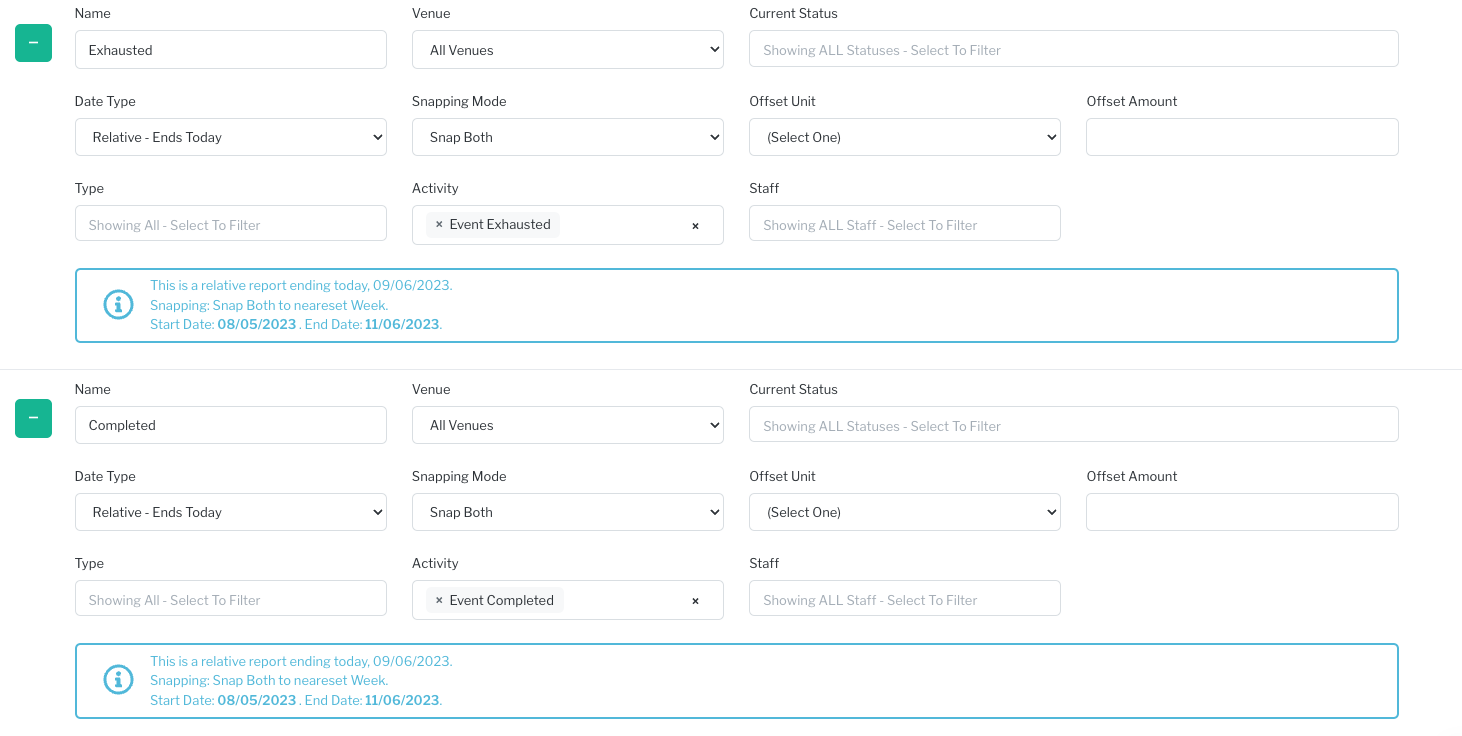
Custom Activity
This example of Custom Activity is a weekly look at activity over 1 month. It is bar chart, but can easily be changed to a line graph or another type to best meet your needs. This report is using week numbers as labels (Week 19, 20, etc).
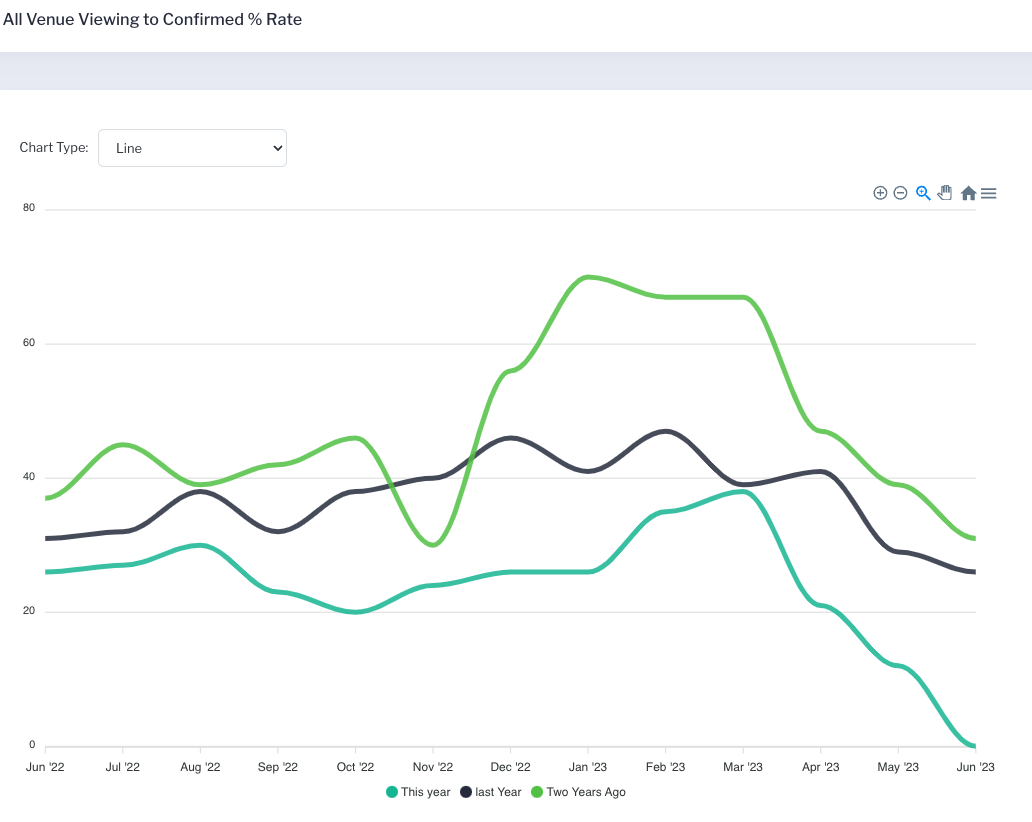
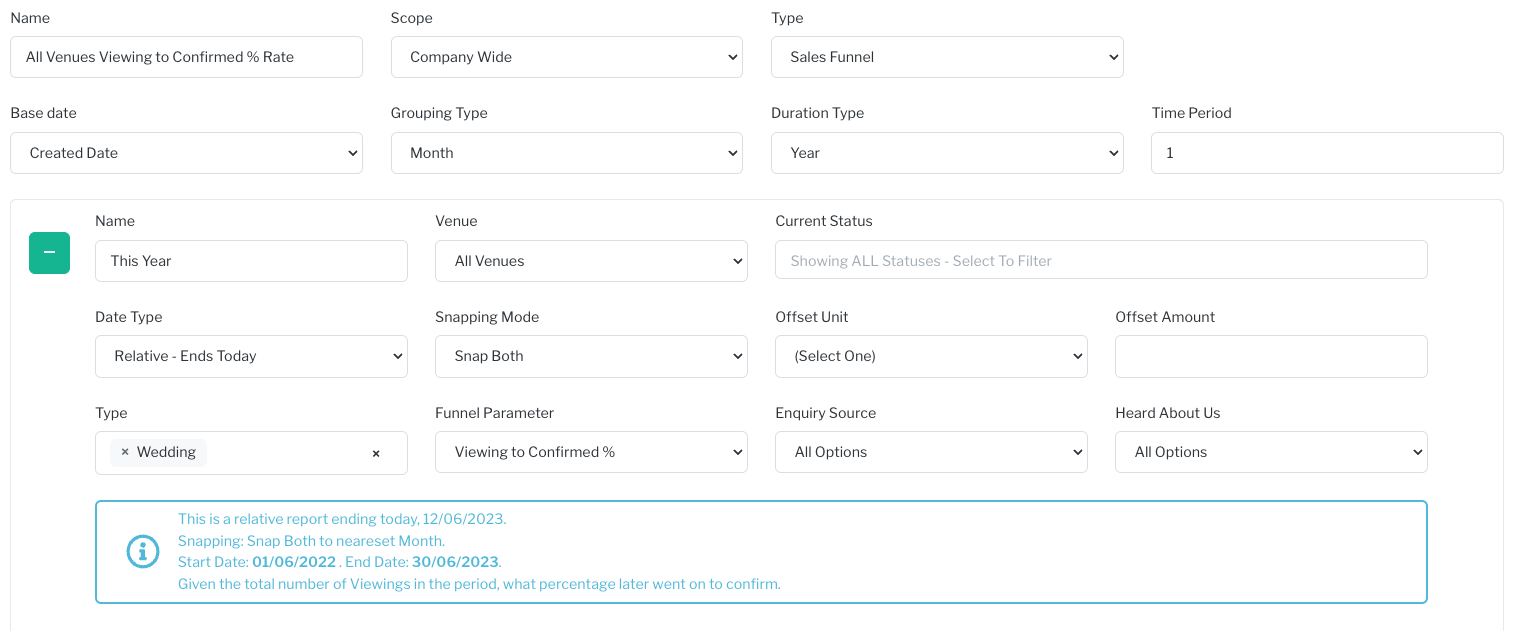
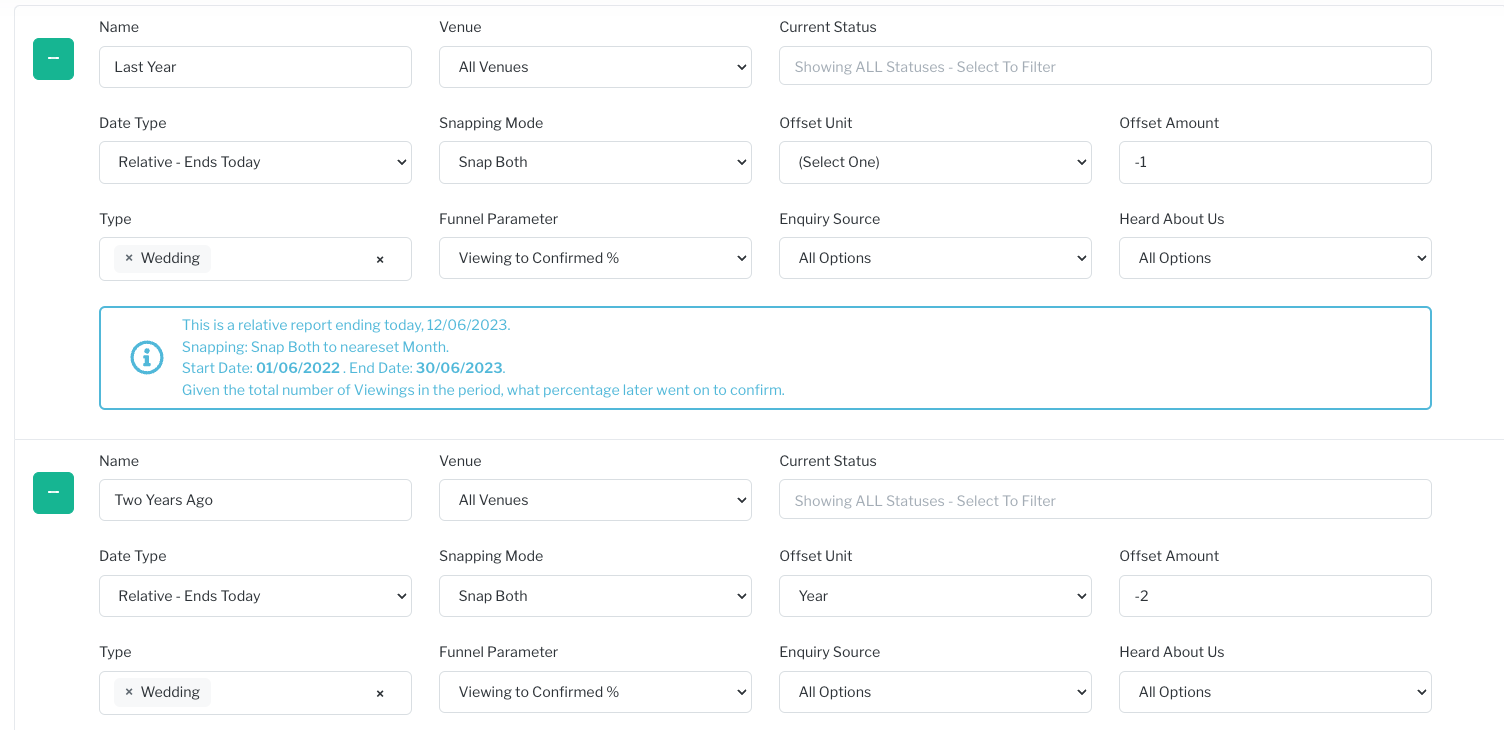
Sales Funnel
This example is showing a year of year comparison of the Viewing to Confirmed % rate.
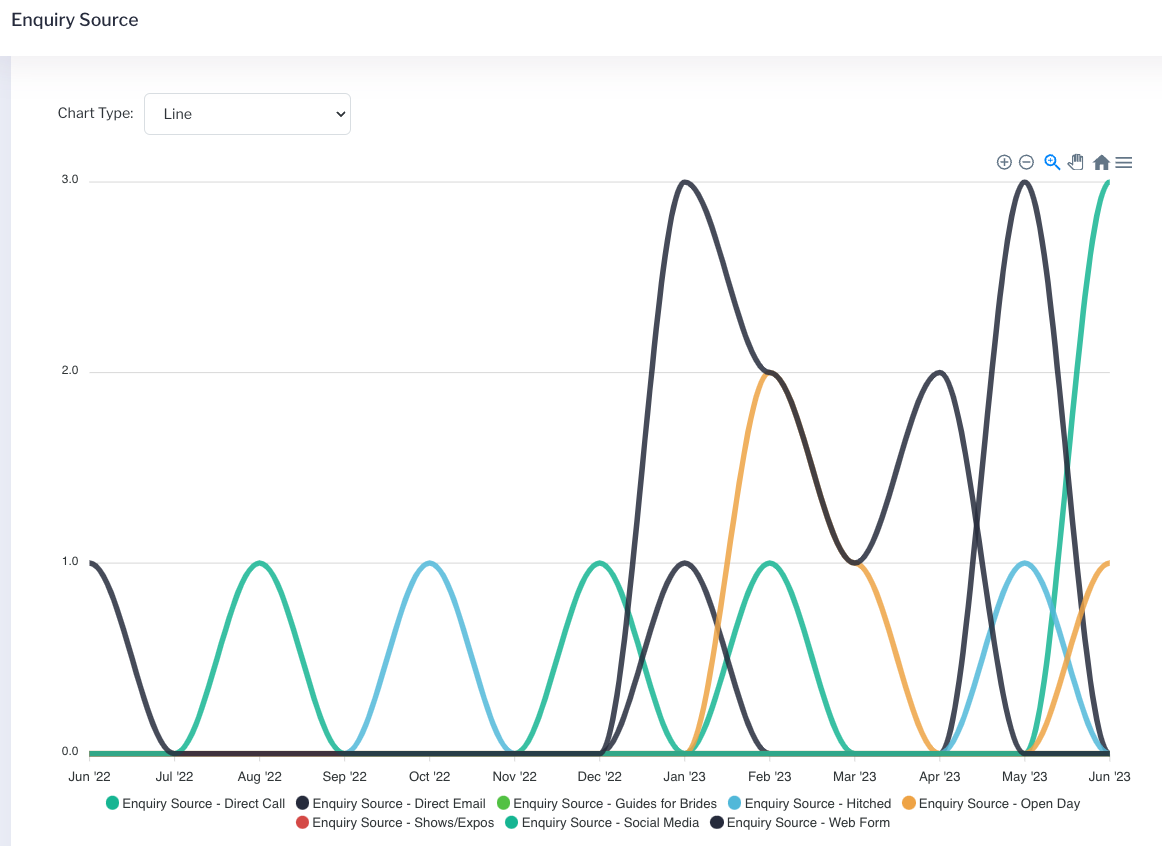
Event Marketing
Here is a look at Enquiry sources, monthly, over a year for all event types.
 There are additional report possibilities for accounting which can be found here: Accounting and Financial Reports
For more in depth details on how to create reports please reference: Creating Reports